
Flatlands
While working with the robots at DLR (the German aerospace center), I’ve been confronted with a new type of data—next to camera images—which I hadn’t come across so far, namely point clouds. As it turns out, point clouds can be an extremely useful extension to the two dimensional RGB camera images already commonly used in scene analysis, for example for object recognition and classification.
However, there are differences between the data types which prevent us from directly applying successful techniques in one area to another. In this post, I’d like to explore those properties after a detailed look at point clouds themselves, to then see which ideas have been employed to extend the deep learning revolution to this promising data type. As usual, you can find the code used to generate all graphics in this post on GitHub and try it out directly on ![]() .
.
What exactly is a point cloud?
As the name suggests, a point cloud is an agglomeration of points in three dimensional space often resembling a cloud, depending on the angle and distance we look at it. Below, you see such a specimen.
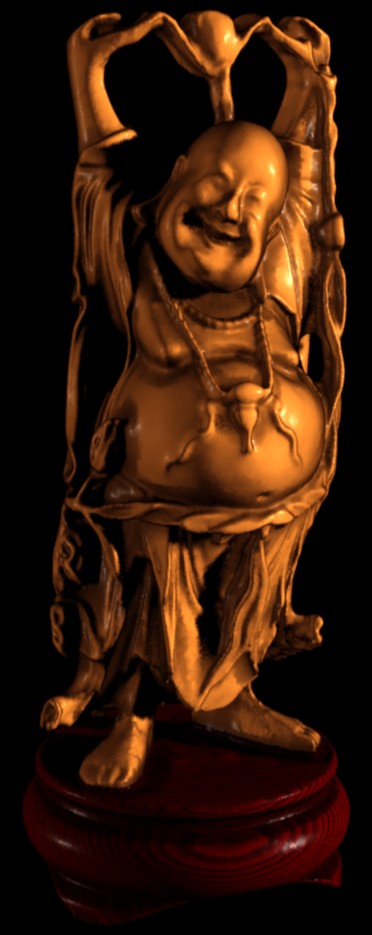
From the given perspective, there is not a lot to see or understand. Now, if you haven’t already, try zooming out using your mouse wheel (or fingers). As you might notice, a distinctive shape emerges, namely that of the Happy Buddha from The Stanford 3D Scanning Repository, where the color of each point encodes the distance from the viewer (depth). Here is an image of it from the front:
Images vs. point clouds
At first glance, images and point clouds seem to be two very different things. Actually though, the underlying concept is the same, they are usually just represented in a different way. It all begins with a bunch of points1. A point can be completely defined by its position in a coordinate frame. For images, this coordinate frame is usually two dimensional, while for point clouds it usually has three dimensions. Below on the left you see a (slightly pixelated version) of the happy Buddha image from before. If you hover over it, you’ll see, for each point, its position in the grid and its RGB color value.2 A point defined by a position in a two-dimensional grid, i.e. by it’s position relative to its neighbors rather than by coordinates in 2D space, is called a pixel3. For example, a pixel with position $(10, 51)$ is the pixel coming after pixel $9$ and before pixel $11$ in horizontal (or $x$, row) direction and identically so for the vertical (or $y$, column) direction.
In contrast, the second image (right), shows the same data, but now represented as a 2D point cloud. Here, each point is defined by a two-dimensional coordinate, independent from its neighbors. To highlight the difference, I’ve removed “empty” space, i.e. (almost) black pixels, “converted” the grid positions into coordinates (by arbitrarily dividing them by 10) and changed the shape of each point to filled circles instead of squares which are typically chosen to represent pixels. Here, the point at coordinates $(1.0,5.1)$ (the same as the example pixel at $(10,51)$ from before) doesn’t care about its neighbors and doesn’t tell us anything about them. Maybe there is another point at $(1.1, 5.2)$, maybe not, we can’t tell just by knowing about the coordinates of the current point. You can zoom in on both representations (by clicking and dragging a rectangle) to further explore the representational differences.
Point clouds vs. voxel grids and meshes
Of course we might wonder now: if an image can become a point cloud, can a point cloud become something more akin to an image? The answer is, absolutely! Enter the voxel grid. A voxel4 is for a point in three dimensions, what a pixel is for a point in two dimensions. Just as with images, the position of a voxel in 3D space is defined by its position in the underlying data structure, a 3D grid, relative to its neighbors. Below you see the voxel representation of the happy Buddha point cloud.
To create it, we simply divide the space into cubes of equal size (the voxel grid) and only display those cubes (voxels) which consume at least a single point from our point cloud.
Each representation has its advantages and disadvantages. Point clouds are closest to the raw data we receive from our depth sensors, so no postprocessing (often including hyperparameters like voxel size) is required. They occupy little memory because of their efficient representation as points in 3D space and their natural sparsity, where empty space is signified by the absence of points in contrast with voxel grids (as well as images for that matter), where emptiness needs to be explicitly encoded to preserve the grid structure.
Downsides of this representation include the irregularity of which the points occupy the space, i.e. distances between points are generally not identical. Further, point clouds are unordered, in contrast to images or voxel grids, where knowing about one voxel (or pixel) provides information about its neighbors.
For voxel grids we have already discussed that they are more structured than point clouds (which means we can use the extension of 2D convolutions when training neural networks on them) but are significantly less memory efficient. Another obvious downside is the loss of information when discretizing the space into cubes (compare the point cloud representation of our happy Buddha to its voxel representation to see this effect).
The last missing representation—at least which I’ll cover in this post as there are numerous more—is the mesh. More precisely, we are usually talking about triangle meshes, which might be familiar to you through 3D graphics and video games, though they are often called polygons instead of triangles in this context. Let’s first have a look at an example before discussing the properties of this type of representation.
The first thing to note about meshes is, that they are not trivial to produce from raw point clouds. For the human eye and brain, it is often possible to make out shapes from a bunch of points, but capturing this mathematically so that we can automatize the process is quite difficult. To see why, go back to the point cloud at the beginning of this post and zoom in on the region of the statue where its torso and robe separate. How do you actually know that there should be empty space between the body and the cloth, i.e. that there shouldn’t be connections between “body points” and “robe points” in this region? It probably has to do with the density of the points around but also with your understanding of human physiognomy and clothing.
Algorithms that can achieve this are outside the scope of this article, just note that they require considerable ingenuity and computational power, but above all, they don’t work universally and require some parameter tweaking for each case.
This is of course bad news if we want to use them for further processing, for example as input data for a machine learning algorithm, because it makes the path from the data acquisition through sensors (which provide point clouds) to the learning algorithm slow and unreliable.
However, if we succeed in producing a high quality mesh from a point cloud, we also gain some great advantages. If you look closely, a mesh is basically a graph, connecting the points of the point cloud (or a subset/subsample thereof) through edges. This means, that points are no longer individuals, but part of a network of neighbors, similar to a voxel grid, but without (or at least reduced) loss of information through discretization as well as smaller file sizes, as empty space can remain empty and unaccounted for. In essence, a mesh provides many of the advantages of voxel grids5 but without their downsides.
Going beyond images
Looking at the amazing results of deep learning techniques on RGB images one might wonder whether we even need anything else. Popular skeptics of 3D data in machine learning like Elon Musk point out, that we humans do just fine without it, so we should focus on bringing our machines around to accomplish the same.
Apart from financial considerations that probably drive Musks view on the subject6 I see at least one other flaw in his line of argument. Just because a biologically evolved entity doesn’t feature some specific capability doesn’t mean that it wouldn’t be beneficial. After all, we didn’t evolve by design but by trial and error.
This brings us to the numerous advantages 3D data potentially holds over its flatlandish sibling. The first is scale invariance. Images are produced through light reflecting from a surface and reaching a lens (be it in a human eye or a camera). This has numerous implications, the most obvious being that objects further away appear smaller than objects closer to the observer, even though they don’t actually change their size. An algorithm therefore needs to learn scale invariance, i.e. that a small car and a large car can actually both be the same car; or it could be that the small car is just a toy. In three dimensions, this hassle disappears by itself, as 3D data is inherently scale invariant by way of its acquisition.
Closely related are viewpoint effects, where only parts of the object can appear overly large by virtue of being much closer to the lens as the rest of the object. No issue in 3D as well. There can also arise problems through adverse or insufficient illumination. Too much light can wash out details and occlude information lying in dark areas, too little light can render image based techniques completely blind. The same is true for dense fog, which is especially critical for autonomous vehicles7
As an aside: Ultimately, we naturally want our algorithms to outperform us and not just to level off at our capabilities, especially in areas like autonomous driving. An easy way to get closer to that goal is to simply equip them with better senses.
The aforementioned advantages translate directly into algorithmic benefits, which I’ll try to cover in the upcoming post on 3D deep learning. Stay tuned!
-
How those points can be obtained is not part of this post but have a look at depth cameras, time of flight (ToF) cameras and LiDARS if you are interested. ↩
-
I’ve introduced this kind of image representation here if you would like to explore this further. ↩
-
Apparently originating from picture element. ↩
-
volume or volumetric element ↩
-
Yes, even the ability to perform convolution operations on them, or, more precisely, on their edges, as we will see in an upcoming post. ↩
-
High quality sensors for 3D data acquisition like LiDARs are still very expensive compared to the more venerable and mature camera technology. ↩
-
To be completely honest, lighting and especially surface properties like reflectance can also adversely affect depth sensors, but usually to a lesser extend. ↩